
When searching the internet - note url's that contain:
gov. - government sites
edu. - educational sites
org. - organizations
If you have trouble finding and citing resources please contact:
Taryn - email: tschmid@okanagan.bc.ca or text /call 250-253-3535
If you would like help with reading, writing and citing please contact:
Joaquim in the Success Centre - email: jcamps@okanagan.bc.ca
Works Cited:
Author. (Year of publication). Title of document: Subtitle if given (No. Report Number if given). URL
example:
Statistics Canada. (2022). A portrait of Canadians who have been homeless. (No.75-006-X202200100002).
https://www150.statcan.gc.ca/n1/en/catalogue/75-006-X202200100002
In-Text - paraphrase
(Author, Year)
example: (Statistics Canada, 2020).
In-Text - quote
(Author, Year, p. Page number)
example: (Statistics Canada, 2020, p.15).
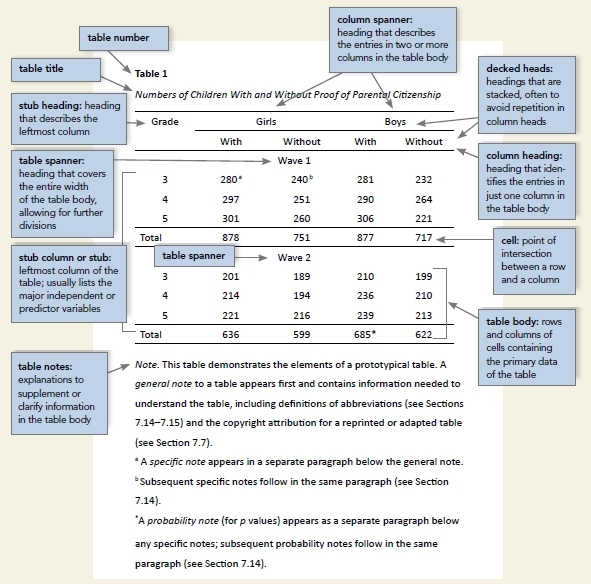
ESSENTIONALS: Table # , Table title, Table Notes (this is where you would include where your graph came from!)
Information taken from the APA Citation Website - where there is MUCH more information available.
When reproducing graphs / charts / etc. in your paper, cite them in the Note underneath the image, using this format:
Reprinted (or Adapted if you've changed it) from "Title." Author. (first initial, second initial, last name). Date. Name of Website, journal or magazine. Retrieved (month, day, year). URL.
In your Bibliography at the end of your paper make sure you include citations for tables, graphs etc.
Author (or Organization). (Year). Title of table/graph. URL
Mulvaney, N., Wubbenhorst, A. & Kaur, A. (n.d.). Modular 2 : How to critically analyze and interpret data
visualizations. In Critical data literacy: Strategies to effectively intrepret and evaluate data
visualizations. Toronto Metropolitan University. Pressbooks.
This site is maintained by the librarians of Okanagan College Library.
If you wish to comment on an individual page, please contact that page's author.
If you have a question or comment about Okanagan College Library's LibGuides site as a whole, please contact the site administrator.